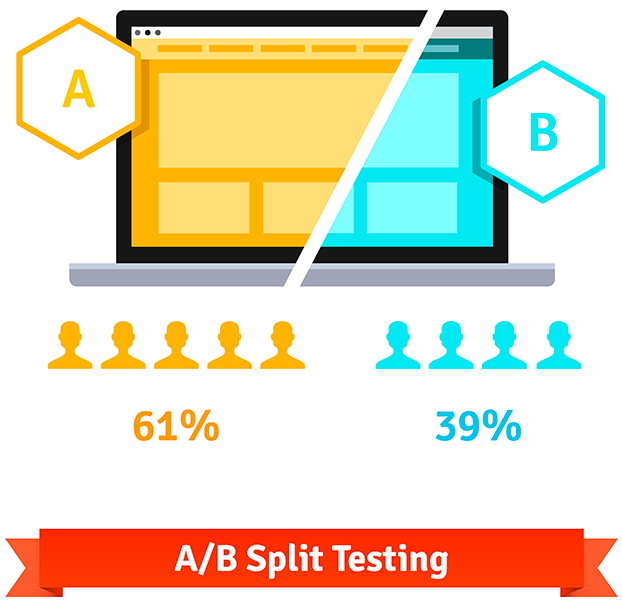
Many of us have heard, read, or even performed an A/B Test before, which means we have conducted a statistical test at some point. Most of the time, we have worked with data from first or third-party sources and performed these tests with ease by either using tools ranging from Excel to Statistical Software and even more automated solutions such as Google Optimize.
If you are like me, you might be curious about how these types of tests work and how concepts such as Type I and Type II Error, Confidence Intervals, Effect Magnitude, Statistical Power, and others interact with each other.
In this post, I would like to invite you to take a different approach for one specific type of A/B test, which makes use of a particular statistic called Chi-Squared. In particular, I will try to explore and walk through this type of test by taking the great but long road of simulations, avoiding libraries and tables, hopefully managing to explore and build some of the intuition behind it.
